Search engines have always been our front door to the world of information. Archie was the first search engine created in 1990 to search for FTP files only. However, a significant shift was observed when Jerry Yang and David Filo founded Yahoo in 1994.
Yahoo used human editors to catalog the web instead of the spider technology and became the largest search engine. It even had the chance to buy Google at one point in time. However, it made some mistakes and ended up losing its dominance.
Sergey Brin and Larry Page created Google in 1998 and offered a significant innovation in search with the PageRank algorithm.
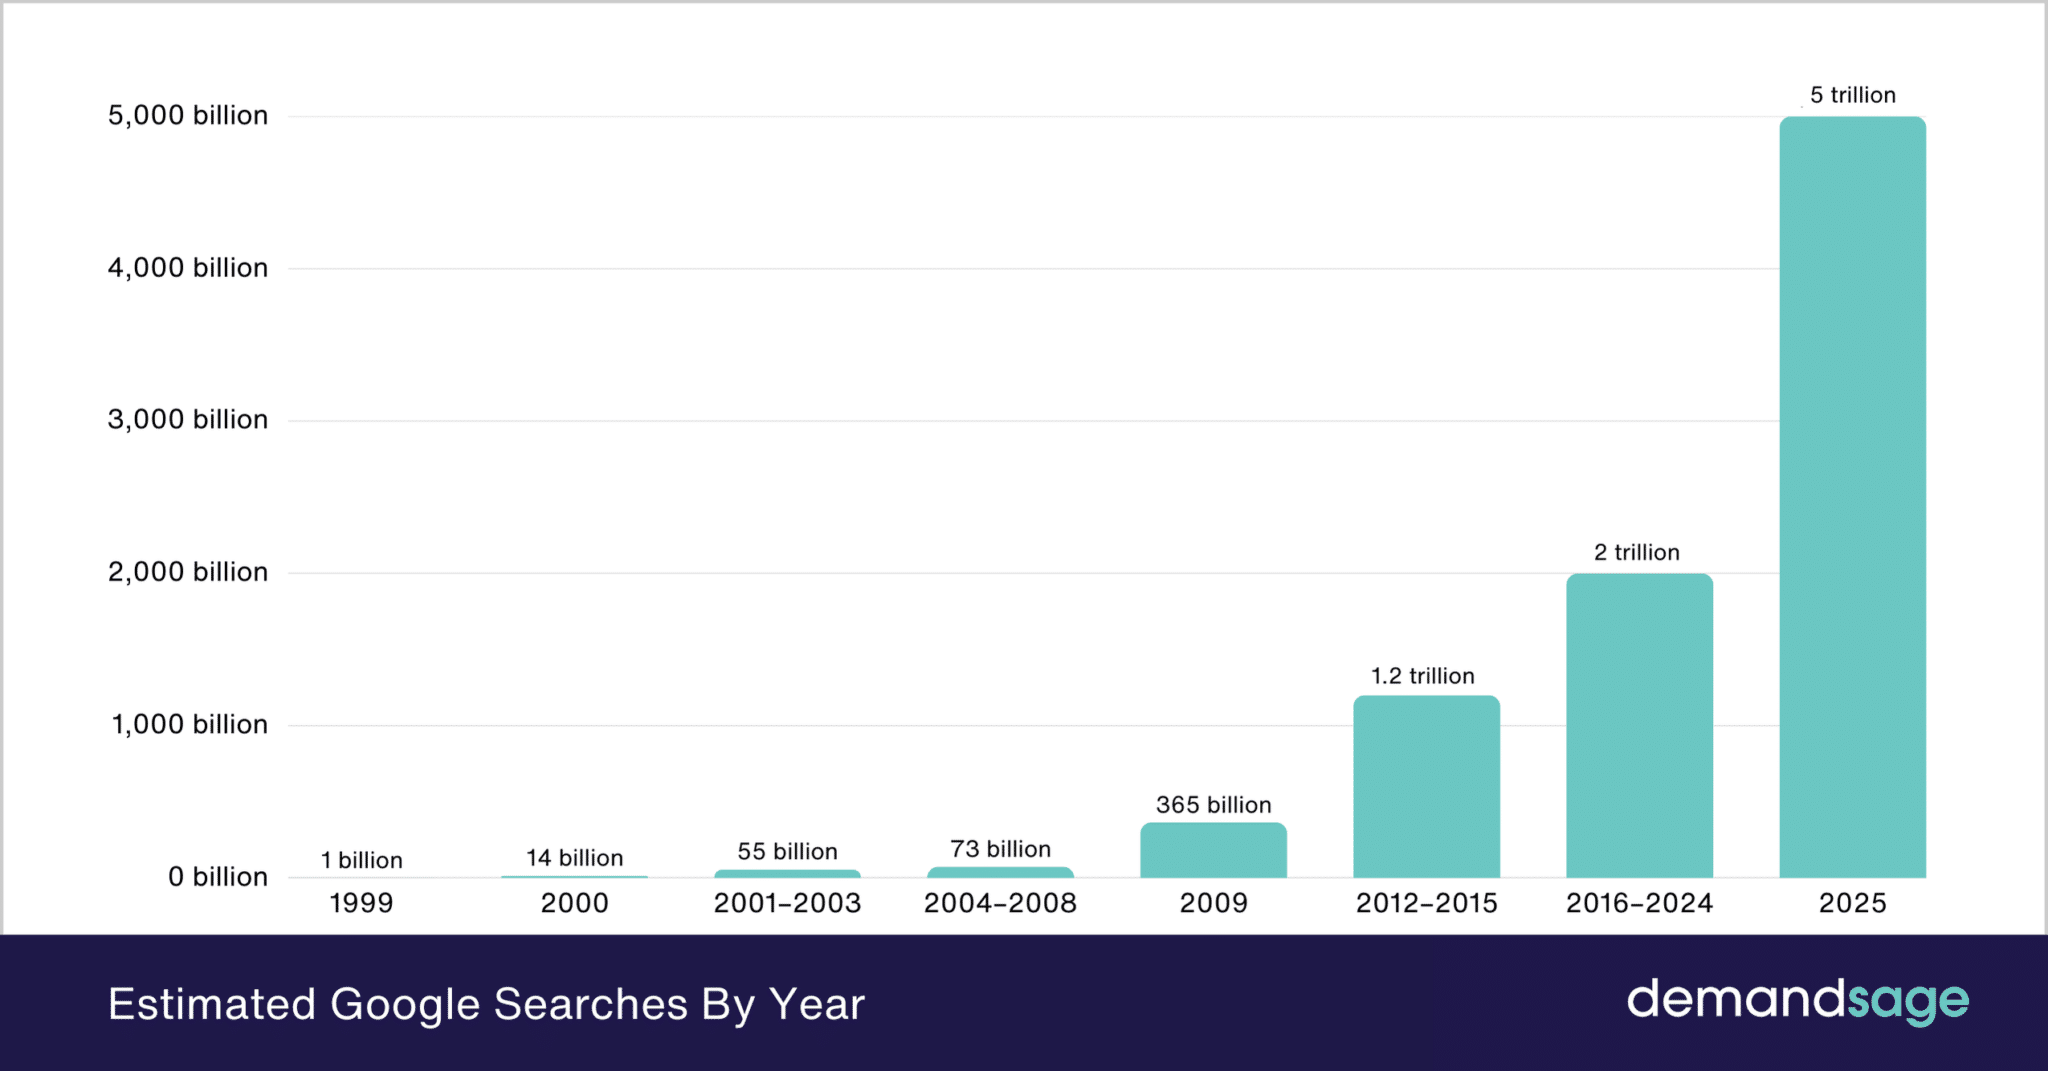
Over the past 26 years, Google has evolved from a novel tool to the default search engine, processing around 99,000 searches every second. Google built a multi-billion-dollar business on search advertising. It has remained largely unchallenged for over two decades, serving as the world’s primary search engine.
Types of Searches
Users turn to search engines like Google, Yahoo, and Bing to find information, websites, products, or services they need. The user enters a set of keywords into the search box, and then search engines provide them with a list of relevant links.
Traditionally, search engines provide links to web pages, and users were mainly concerned with finding web pages that contained the information they wanted. However, this is no longer the case.
Nowadays, people just want a quick answer to a question or for a product they can buy. That is why modern search engines like Google provide featured snippets or a product link. To do this, search engines have to understand the user intent.
So, the search is categorized into four different types:
- Transactional searches: This query shows the user wants to buy a product.
- Navigational searches: This query shows the user is looking for a specific site.
- Informational searches: These type of searches means the user is looking for some information.
- Commercial searches: This query type means the users are seeking brand names.
The Rise of AI
People have been using Google as a primary search engine for over 2 decades. However, search is no longer confined to Google or browsers. It is evolving beyond traditional browsers, shifting to answer engines. In fact, Google’s search market share dropped to 90% in 2024 due to the growing popularity of AI-driven tools.
So, traditional web-based searches may not be our primary tool for finding information in the future.
Let’s discuss this with examples:
For example, Perplexity – a free AI search engine – is designed to revolutionize the way we search. The user just has to ask a query, and it will search the Internet and give an accurate and verifiable answer.
ChatGPT is another example of how AI is changing the way people search. It has 1 million active users within just 5 days of its launch. Today, it receives more than 10 million queries per day.
Unlike traditional search engines, which rely on keywords and deliver a list of relevant links, ChatGPT allows users to ask questions, provide context, and clarify their queries. It engages in conversation with users, allowing them an interactive and personalized experience.
Moreover, it eliminates the process of sifting through multiple links of search results to get an accurate answer. This not only gives users instantaneous access to information but also saves them time.
Like Perplexity and ChatGPT, there are several AI tools that people are currently using for search, meaning people are leaving your browser.
Changing World of ‘Search’ and Future Search Trends
Search is like the front door to your website. It is the most effective way to reach your audience. However, the way people search has changed a lot.
While Google is the dominant search engine in 2024, its market search share is reduced to 81.95%. Nowadays, people use social media platforms, visual content, e-commerce sites, forum posting sites, and scholarly literature sites, depending on their needs and preferences.
This shift is driven by evolving technologies, user behaviors, AI and chatbots, and the increasing influence of multimedia content.
Here are some future trends shaping the world of search:
Social Media Search
According to research conducted by Forbes Advisor, 46% of Gen-Z prefer searching on social media instead of using traditional search engines like Google.
| Generations | Social Media Search Share |
| Generation Z (1997-2006) | 46% |
| Millennials (1981-1996) | 35% |
| Generation X (1965-1980) | 18% |
| Baby Boomers (1946-1964) | 7% |
| Silent Generation (1925-1945) | 2% |
Many use social media to discover new brands and products. In fact, there has been a 30% decline in search engine use for brand discovery, especially among Gen Z.
65% of social media users discover new brands via social media platforms at least once a month. Out of these users, Gen Z is the most engaged across social media platforms, with 44% discovering new brands daily and 33% weekly.
The platforms people use for search are:
| Platform | Generatio Z | Millennials | Generation X | Baby Boomers |
| YouTube | 77% | 84% | 77% | 66% |
| 77% | 62% | 49% | 29% | |
| TikTok | 73% | 55% | 45% | NA |
| 65% | 73% | 75% | 76% | |
| Snapchat | 59% | NA | NA | NA |
| NA | 76% | NA | 71% | |
| NA | NA | 82% | 21% |
While people use various social media platforms for search, YouTube is the most popular social media search engine, followed by Facebook, TikTok, and Instagram.
- YouTube is the second most popular platform used for search after Google.
- The average number of Facebook searches is over 2 billion a day.
- 83% of Instagram users use it to discover new products or services.
What are users searching for?
- Most searches on YouTube are for updates on restaurants and football.
- On Facebook, the most searched area is ‘News & Current Affairs’ followed by ‘Recipes and Meal Ideas.’
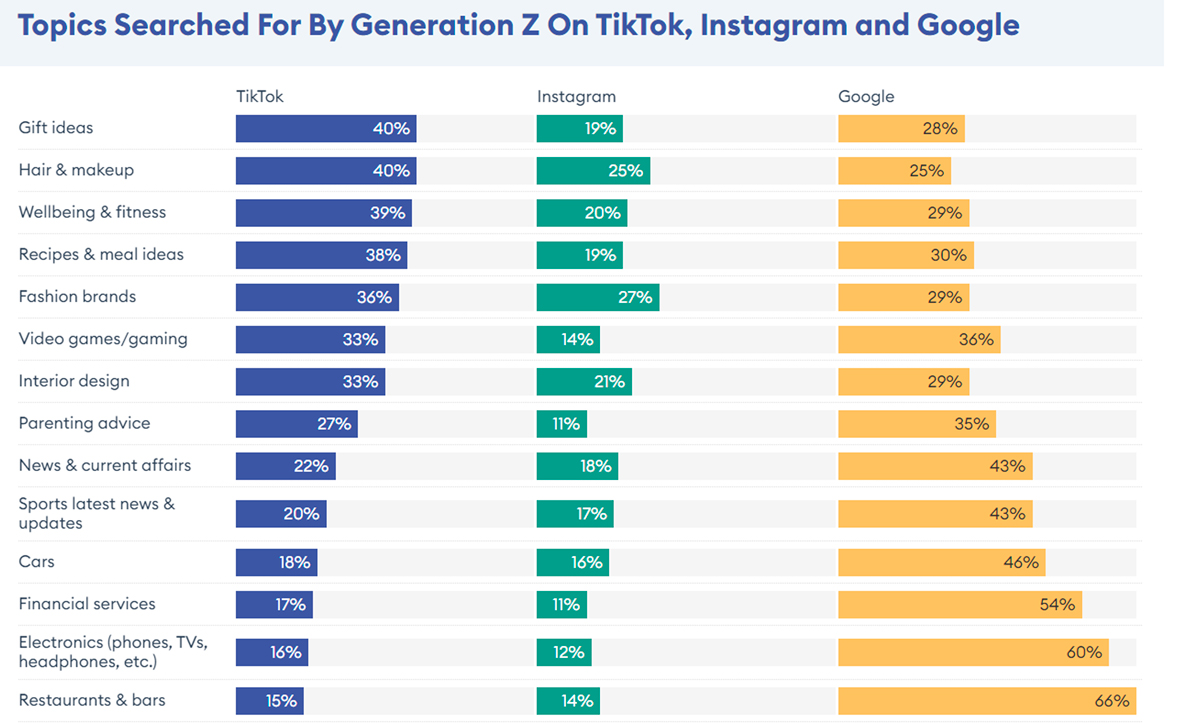
- TikTok users most often search for ‘Hair and Makeup,’ followed by Recipes and Meal Ideas and Gift Ideas.
- People use Instagram to search for ‘Fashion Brands,’ followed by ‘Hair and Makeup’ and ‘Interior Design.’
- People use Pinterest to search for visual ideas and inspirations for fashion and house renovations.
- Social media search is a valuable tool for sales professionals seeking new leads. So, professionals use LinkedIn for new leads and to enhance their network.
Voice Assistant Search
Voice search and natural language processing (NLP) are changing search trends. Around 125.2 million of the global online population uses voice search services, and 62% of Americans over 18 use a voice assistant on any device. These devices include:
- Voice-activated speakers
- TVs and remotes
- Smartphones
- Computers
- Laptops and Tablets
- In-car systems
- Voice bots
- Virtual assistants, such as Cortana, Alexa, Siri, etc.
According to Yaguara, Google Assistant is the most popular digital assistant, followed by Siri and Alexa. Here is the search market share for various digital assistants:
| Digital Assistants | %age of people |
| Google Assistant | 36% |
| Apple’s Siri | 36% |
| Amazon Alexa | 25% |
| Microsoft Cortana | 19% |
| Others | 1% |
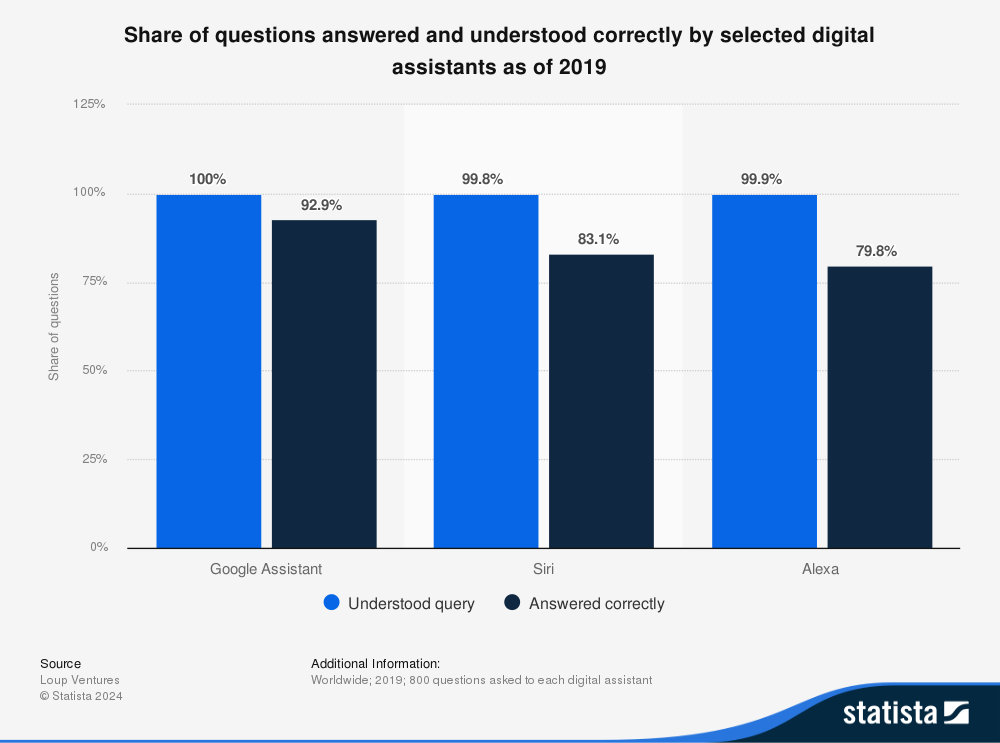
According to Statista, Google Assistant understood 100% of queries and answered 92.9% of queries accurately. On the other hand, Siri could answer 83.1% of queries accurately, followed by Alexa with a 79.8% accuracy rate.
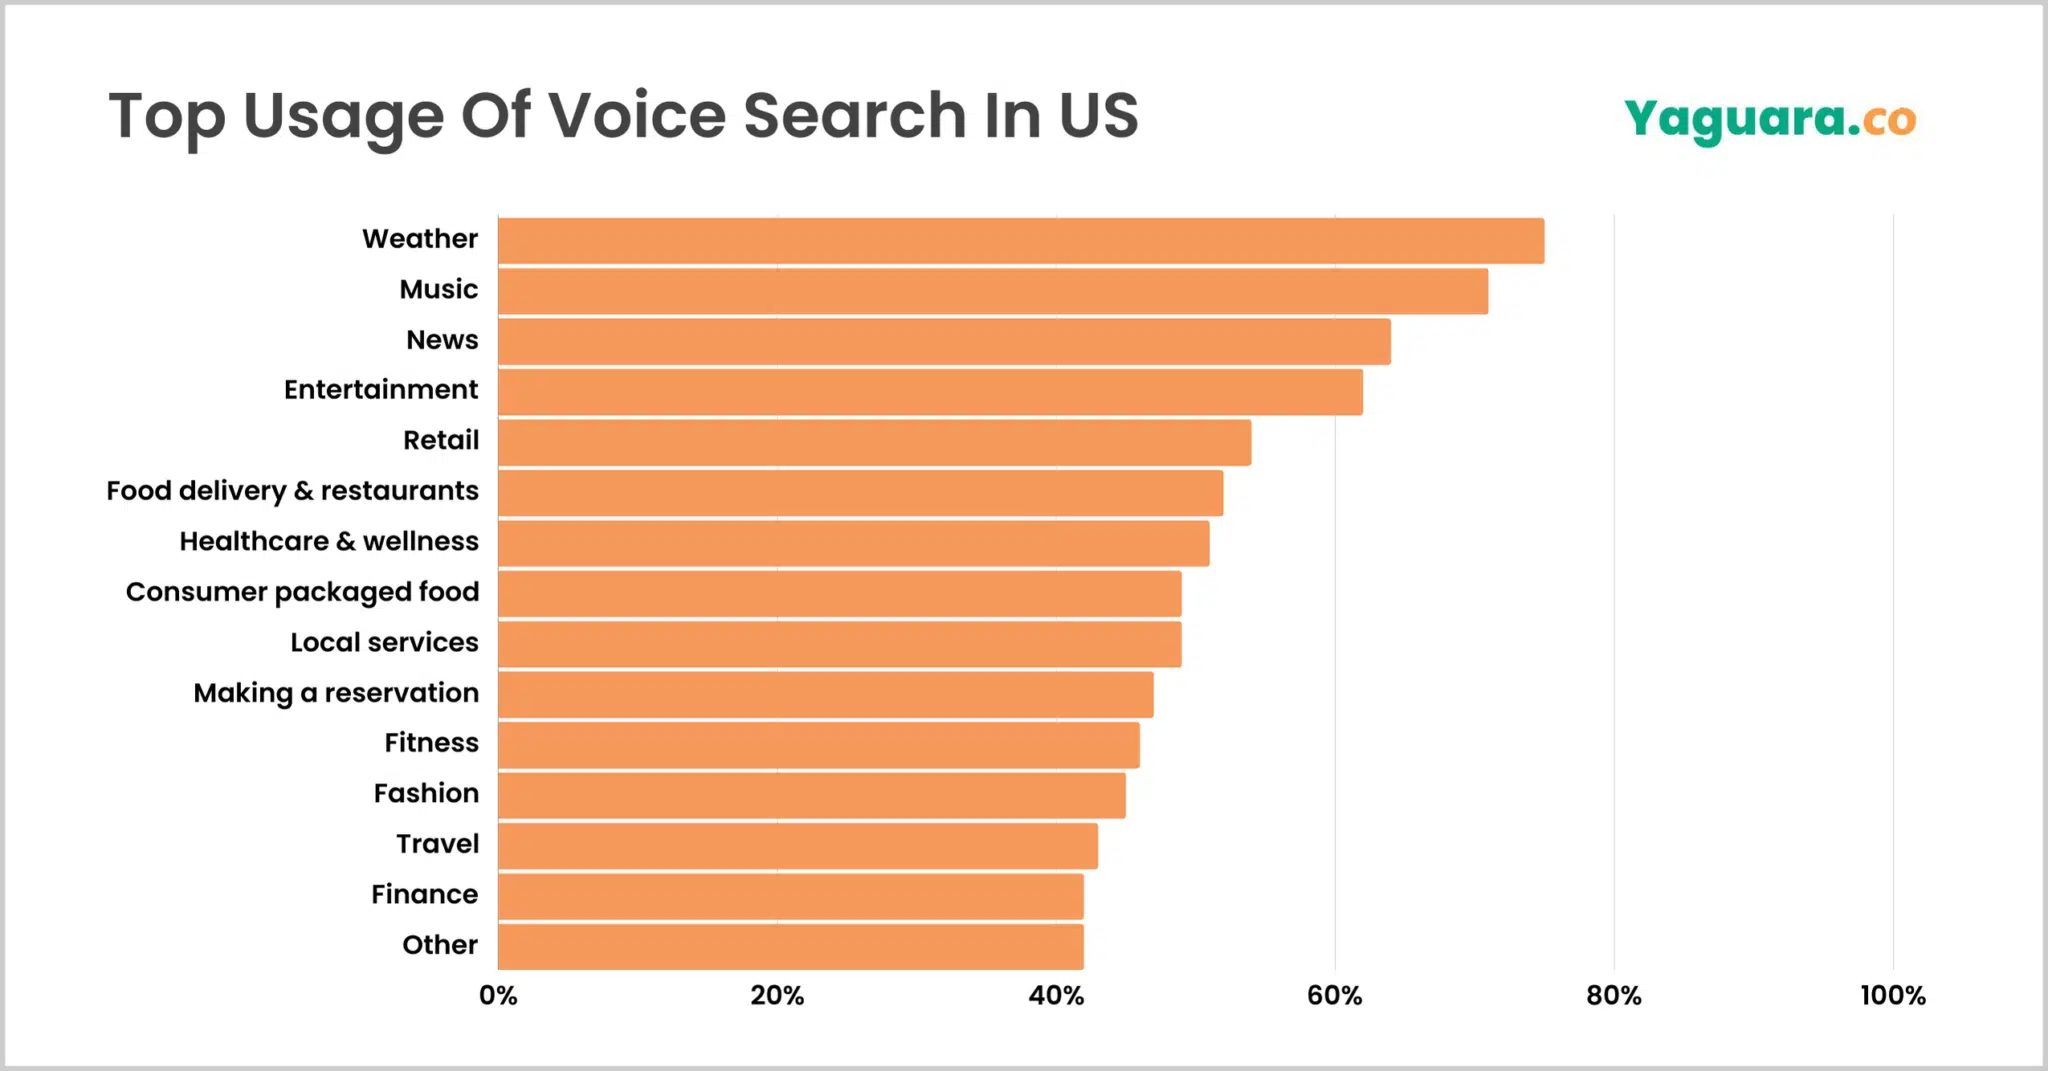
What are people searching for?
Visual and Image-Based Search
Visual search harnesses AI, machine learning, and image recognition to enable users to search for information or products based on images and videos. People nowadays use several platforms for visual search, including:
- ViSenze
- Turing Analytics
- Cortexica Vision Systems
- Alphabet
- Snap
- Veritone
- Amazon
- Microsoft
According to Data Bridge, the visual search market is expected to reach $32 billion by 2028, growing at a CAGR of 17.5%. And approximately 62% of Millennials and Gen-Z customers want visual search more than any other technology.
Moreover, 55% of consumers believe that visual search influences their style and taste.
According to EMarketer, Google gets 20 billion Lens searches per month. Out of which 4 billion are related to shopping.
Here is a table of product categories for which people use visual search:
|
Product Category |
%age |
| Clothes | 86% |
| Furniture | 85% |
| Cars | 58% |
| Groceries | 56% |
| Vacations | 55% |
| Household Items | 46% |
| Electronics | 41% |
| Wine and Spirits | 41% |
There are over 600 million visual searches on Pinterest every month.
E-Commerce Site Search
People seeking products and services need quick product or service links in today’s fast-paced world. So, they use various e-commerce sites, such as Amazon, for product searches instead of traditional search engines like Google.
According to Andrea Polonidi, a product manager at Coveo, about 30-60% of e-commerce shoppers conduct on-site searches, and those who do are likely to convert at almost double the rate of those who don’t.
Moreover, as per SearchNode internal data, 30-60% of all eCommerce site revenue is generated by on-site searches. The most common e-commerce search engines are:
- Google Shopping
- Amazon Marketplace
- Bing Shopping
- eBay Shopping
- Walmart Marketplace
- Etsy Search
- Facebook Shops
- Shopzilla
- Yahoo Shopping
According to a Hitwise study, 77% of people searched for headphones on Amazon instead of Google, whereas 56% of people conducted game searches on Google. Below is the table showing the share of consumers conducting some of the top product searches on Amazon as compared to Google:
|
Search Group |
Amazon Exclusive |
Google Exclusive |
| Headphones | 77% | 22% |
| Phone | 70% | 27% |
| PC | 68% | 30% |
| Kindle/echo | 65% | 32% |
| TV | 55% | 41% |
| Toys | 41% | 55% |
| Christmas | 40% | 57% |
| Wearables | 39% | 55% |
| Gaming | 38% | 56% |
| Movie/Show | 32% | 66% |
Video Search
Video content is one of the most popular forms of search people opt for nowadays. Around 69% of consumers prefer videos over text to learn about a product. And 59% of senior executives prefer watching videos as compared to reading text.
YouTube
According to demandsage, YouTube is the most searched term on Google, with an impressive 1.3 billion searches each month.
YouTube is the second most popular search engine after Google. Around 500+ hours of content are uploaded to YouTube every minute. Over 1 billion hours of videos are watched on YouTube every day. YouTube experienced a 4.9% growth rate in 2021, and in 2022, the total number of viewers was 210 million in the US alone. YouTube is also a social media platform with 2.7 billion active users after Facebook.
What do people search for on video-sharing platforms?
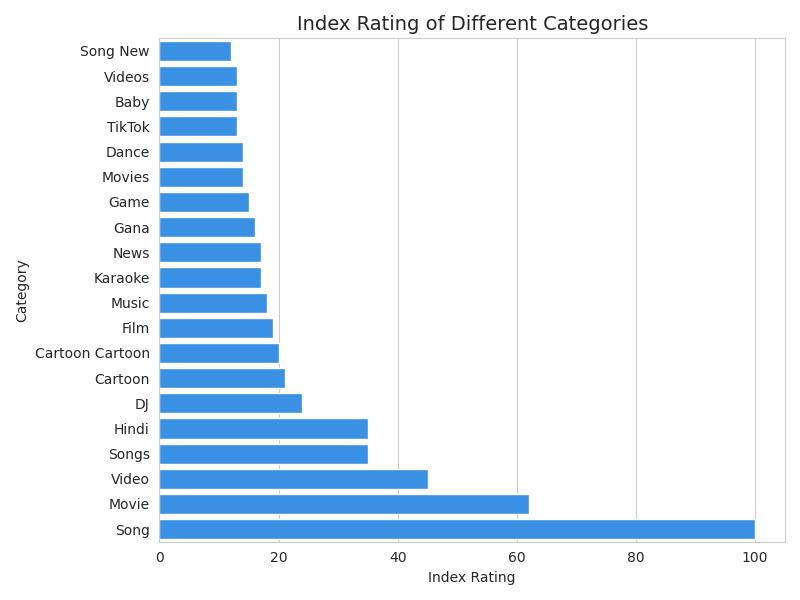
According to Statista, the global top YouTube search queries in 2024 are:
Dailymotion
After YouTube, Dailymotion is another video-sharing platform that has over 300 million monthly users who watch 3.5 billion videos.
The top 10 video-sharing platforms with active users are:
|
Platform |
Active Users |
| Facebook Watch | 2.93 billion |
| YouTube | 2.7 billion |
| Dailymotion | 300 million |
| Vimeo | 230 million |
| TikTok | 1 billion |
In Sep 2024, Dailymotion has 500.3 million monthly traffic. Out of which 29.83% was via desktop and 70.17% via mobiles.
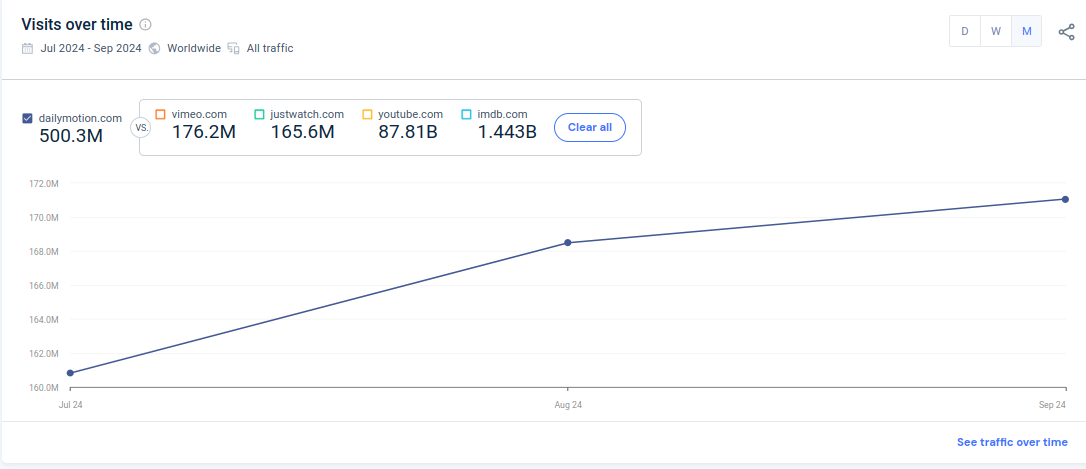
Traffic share from the top 5 countries
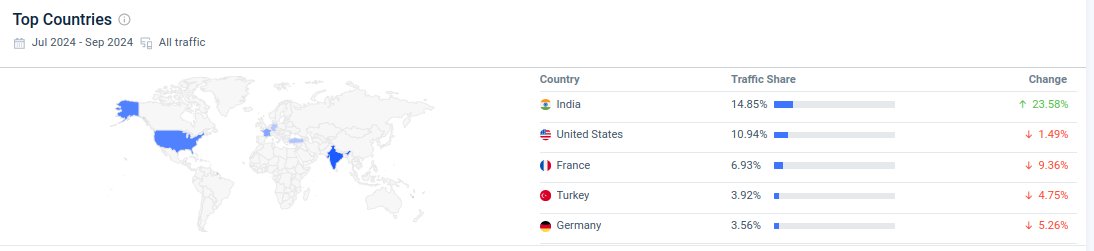
According to similarweb, 29% of adults between 25 and 34 years old use Dailymotion for their search.
|
Age |
Search Share |
| 18-24 | 22.38% |
| 25-34 | 29% |
| 35-44 | 20.08% |
| 45-54 | 13.1% |
| 55-64 | 9.03% |
| 65+ | 6.41% |
Apart from YouTube and Dailymotion, people also use some social media platforms like Facebook, Instagram, TikTok, etc. for video searches.
Healthcare Search
People who want to learn about health issues look for healthcare websites instead of Google. According to the Semrush Traffic Analytics tool, the most popular healthcare website in Sep 2024 was nih.gov, with 251,502,944 monthly visitors, followed by healthline.com and mayoclinic.org.
The average bounce rate is 65.73%, with verywellhealth.com having the highest at 85.23%. On the other hand, google.com.eg has the lowest bounce rate of 30.91%.
According to similarweb, the top 10 healthcare websites people use for search are:
|
Website |
Monthly visits |
| nih.gov | 201.9M |
| healthline.com | 147.5M |
| mayoclinic.org | 115.2M |
| webmd.com | 98.20M |
| cvs.com | 91.55M |
| clevelandclinic.org | 90.31M |
| medicalnewstoday.com | 68.23M |
| walgreens.com | 58.39M |
| 1mg.com | 54.70M |
| nhs.uk | 47.33M |
Forum Search
Nowadays, many also use community forum sites for discussions and to ask questions. In fact, 76% of internet users participate in some form of online community. According to similarweb, the total traffic of different forum sites in April 2022 was:
|
Forum |
Total Traffic |
Organic Traffic Share |
| reddit.com | 1.6 billion | 46% |
| quora.com | 500 million | 70% |
| stackoverflow.com | 274.4 million | 88% |
| forum.xdadevelopers.com | 14.7 million | 30% |
| ubuntuforums.org | 800 thousand | 80% |
| digitalpoint.com | 186 thousand | 46% |
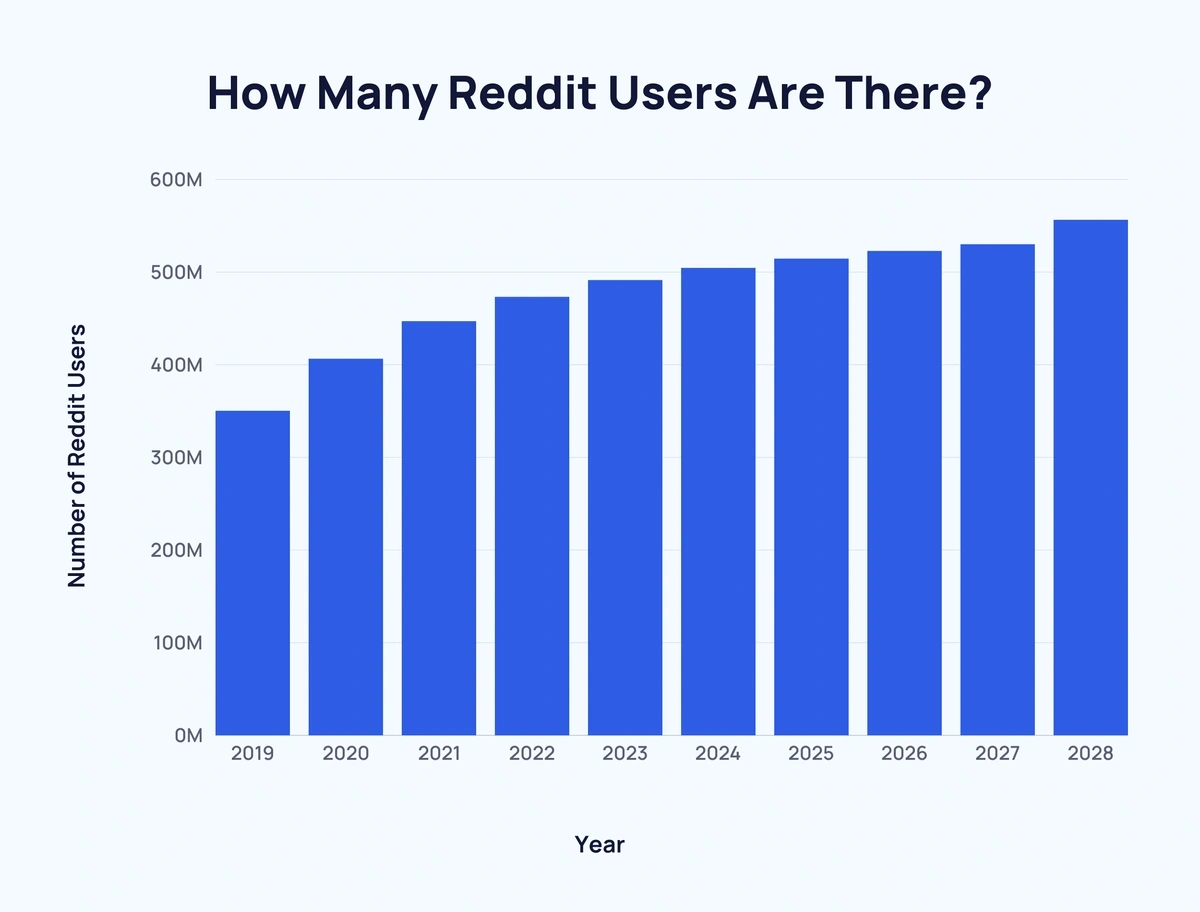
In 2024, Reddit has over 500 million active users. According to Exploding Topics, the number of Reddit users over time is:
In the US, Reddit is widely used by people between the ages of 18-29 years old. Here is a more detailed look at the US Reddit users by age:
|
Age Group |
%age of Reddit Users in the US |
| 18-29 | 44% |
| 30-49 | 31% |
| 50-64 | 11% |
| Above 65 | 3% |
The number of Reddit users in other countries are:
|
Country |
%age of Reddit Users |
Monthly Traffic |
| US | 48.33% | 13.6 million |
| UK | 7.33% | 2.3 million |
| Canada | 6.97% | 1.8 million |
| Australia | 4.16% | 0.823 million |
| Germany | 3.06% | 1.2 million |
| Others | 30.16% | 9 million |
As of 2024, there are over 3.5x more mobile Reddit visits than desktop per month.
Mobile: 5.9 billion
Desktop: 1.67 billion
Why do people use Reddit?
According to Statista, Americans use Reddit for the following reasons:
Quora
In 2024, Quora has over 400 million active users. The number of Quora users in different countries is as follows:
| Country | Quora Users | Share in total user count |
| US | 148 M | 37% |
| India | 100 M | 25% |
| Europe | 70.5 M | 17.6% |
| SEA | 24 M | 6% |
| UK | 22.4 M | 5.6% |
| MFNA | 20 M | 5% |
| Canada | 15 M | 3.7% |
| ANZ | 11 M | 2.7% |
| Japan | 6.8 M | 1.7% |
| Mexico | 3.5 M | 0.87% |
| Brazil | 2.6 M | 0.65% |
Nearly 98.95% of Quora’s traffic comes from organic search and direct visits, it also gets traffic from other channels, including email, referrals, social, paid search, etc.
Here is the breakdown of Quora users across different channels:
|
Channels |
Traffic on Quora |
| Direct | 21.13% |
| 0.27% | |
| Referrals | 0.72% |
| Social | 0.06% |
| Organic Search | 77.82% |
| Paid Search | 0.00% |
| Display Ads | 0.00% |
Quora is widely used by people between the ages of 25-34 years old. Here is a more detailed look at the Quora users by age:
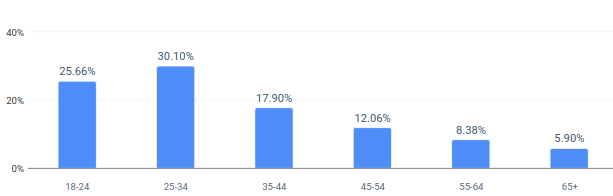
|
Age Group |
%age of Quora Users |
| 18-24 | 25.66% |
| 24-34 | 30.10% |
| 35-44 | 17.90% |
| 45-54 | 12.06% |
| 55-64 | 8.38% |
| Above 65 | 5.90% |
As of 2024, there are more mobile Quora visits than desktop per month.
Mobile: 73.2%
Desktop: 26.8%
As of 2023, the most subscribed topics on Quora are:
|
Rank |
Category |
Audience (Million) |
|
1 |
Technology | 33.9 |
|
2 |
Science | 22.1 |
|
3 |
Movies | 19.5 |
|
4 |
Music | 17.5 |
|
5 |
Health | 17.2 |
|
6 |
Books | 17 |
|
7 |
Education | 16.7 |
|
8 |
Food | 16.2 |
|
9 |
Business | 15.8 |
|
10 |
Visiting and Travel | 15.3 |
|
11 |
Psychology | 12.9 |
|
12 |
History | 11.6 |
|
13 |
Cooking | 10.6 |
|
14 |
Photography | 10.3 |
|
15 |
Design | 10.2 |
|
16 |
Sports | 9.9 |
|
17 |
Economics | 9.1 |
|
18 |
Writing | 8.9 |
|
19 |
Fashion and Style | 7.7 |
|
20 |
Philosophy | 7.2 |
Like Reddit and Quora, people use several more platforms, such as Discord and Github, for queries.
| Note: Not all users access forum search platforms directly. Many users land on Reddit, Quora, and other community forums through Google searches rather than navigating to these platforms intentionally. As a result, the actual usage and engagement statistics may vary. |
AI Chatbots and Tools
With the rise of AI, people nowadays use AI chatbots for their queries.
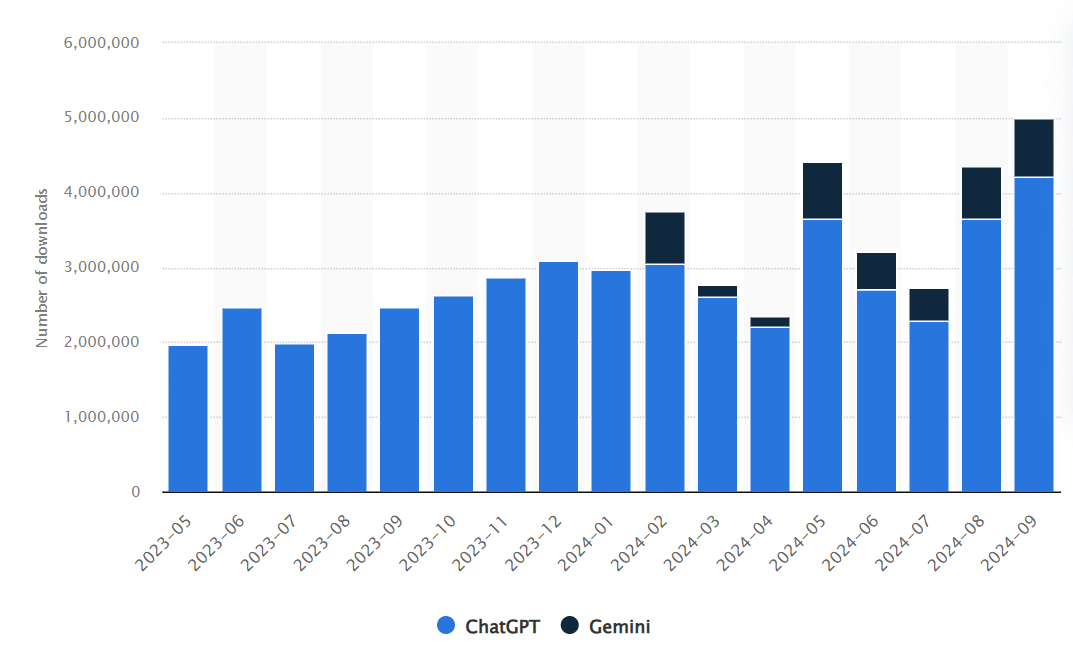
ChatGPT
Surpassing 1 million users within just 5 days of launch, ChatGPT currently has 180.5 million users. According to OpenAI’s chief, Sam Altman, ChatGPT draws in 100 million users weekly.
According to similarweb, ChatGPT had 380.7 million total visits from July 2024 to Sep 2024. The monthly visits of ChatGPT from November 2022 to February 2024:
|
Time Period |
Visits Count | Monthly Change |
Monthly Change Percentage |
| November 2022 | 152,700,000 | – | – |
| December 2022 | 266,000,000 | ↑ 113,300,000 | ↑ 74.2% |
| January 2023 | 616,000,000 | ↑ 350,000,000 | ↑ 131.58% |
| February 2023 | 1,000,000,000 | ↑ 384,000,000 | ↑ 62.34% |
| March 2023 | 1,600,000,000 | ↑ 600,000,000 | ↑ 60% |
| April 2023 | 1,800,000,000 | ↑ 200,000,000 | ↑ 12.5% |
| May 2023 | 1,800,000,000 | – | – |
| June 2023 | 1,600,000,000 | ↓ 200,000,000 | ↓ 12.5% |
| July 2023 | 1,500,000,000 | ↓ 100,000,000 | ↓ 6.25% |
| August 2023 | 1,400,000,000 | ↓ 100,000,000 | ↓ 6.67% |
| September 2023 | 1,500,000,000 | ↑ 100,000,000 | ↑ 7.14% |
| October 2023 | 1,700,000,000 | ↑ 200,000,000 | ↑ 13.33% |
| November 2023 | 1,700,000,000 | – | – |
| December 2023 | 1,600,000,000 | ↓ 100,000,000 | ↓ 5.88% |
| January 2024 | 1,659,100,000 | ↑ 59,100,000 | ↑ 3.69% |
| February 2024 | 1,675,900,000 | ↑ 16,800,000 | ↑ 1.01% |
Approximately 71.13% of ChatGPT traffic comes directly, whereas 0.12% of traffic comes from emails.
The top industries that use ChatGPT are as follows:
|
Industry |
Traffic Share |
| Programming and Developer Software | 42.46% |
| Search Engines | 10.24% |
| Human Resources | 7.69% |
| Computers, Electronics and Technology | 6.18% |
| Video Games, Consoles and Accessories | 5.73% |
As of January 2023, ChatGPT usage by age group:
|
ChatGPT Awareness Levels |
18-29 | 30-44 | 45-64 |
65+ |
| Personal use for text generation | 15% | 17% | 9% | 5% |
| Observed text generated for others, not personally used | 48% | 46% | 27% | 30% |
| Neither used nor observed its use | 20% | 31% | 55% | 59% |
| Uncertain | 17% | 6% | 8% | 6% |
Gemini
Google’s AI chatbot, formerly known as Bard, had an average of 274.7 million monthly visits in Sep 2024. Over 76% of the Gemini traffic is recorded as direct traffic. The user base of Gemini comprises 58.52% males and 41.48% females.
The number of Gemini downloads over time are as follows:
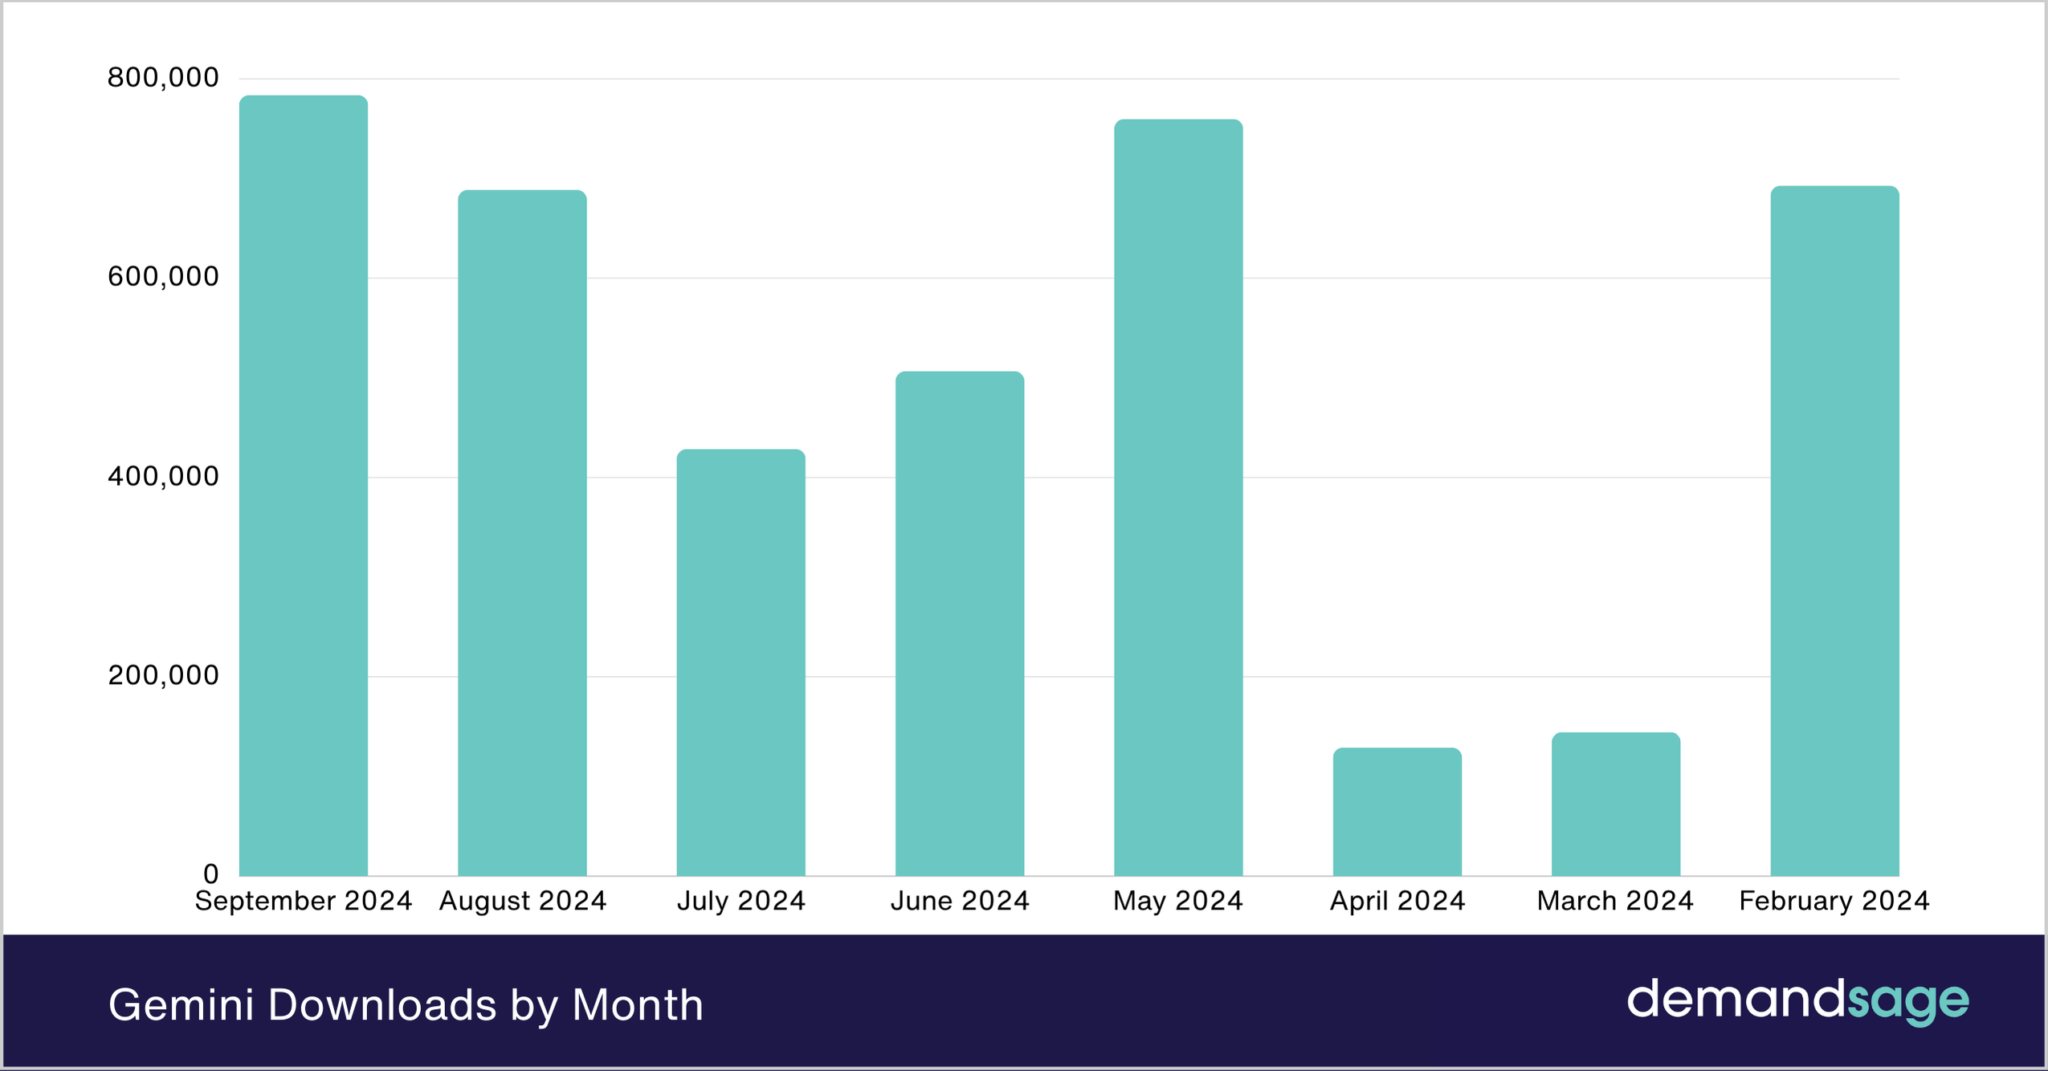
According to Statista, the number of Gemini AI mobile app downloads in the US from May 2023 to September 2024 are:
|
Month |
No. of Gemini Downloads |
|
Sep 2024 |
783,632 |
|
Aug 2024 |
688,684 |
|
July 2024 |
428,487 |
|
June 2024 |
506,727 |
|
May 2024 |
759,766 |
|
April 2024 |
128,948 |
|
March 2024 |
144,440 |
|
Feb 2024 |
692,835 |
Gemini users by age group are as follows:
|
Age Group |
Share of Visitors |
|
18-24 |
23.27% |
|
25-34 |
31.10% |
|
35-44 |
19.07% |
|
45-54 |
13.15% |
|
55-64 |
8.24% |
| Above 65 |
5.18% |
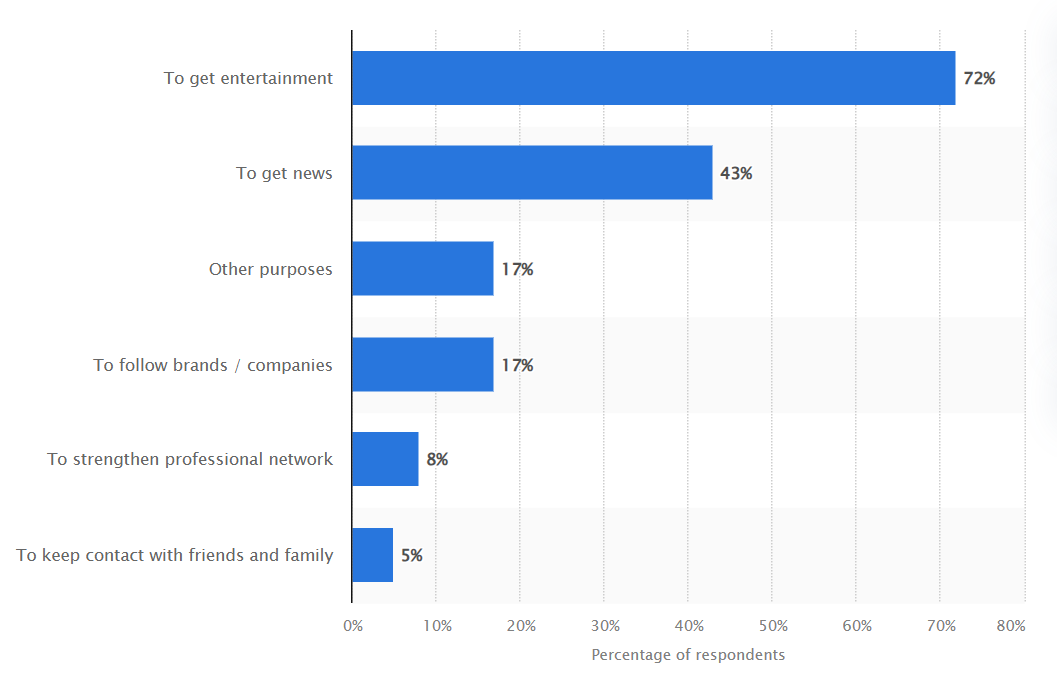
Users use Gemini for various purposes. Here is a breakdown of users using Gemini for:
|
Usage Purpose |
%age of users |
|
Research |
40% |
|
Creativity |
30% |
|
Productivity |
20% |
| Entertainment |
10% |
Types of traffic recorded on Gemini
|
Channel of Traffic |
%age of Traffic on Gemini |
|
Direct Traffic |
76.74% |
|
Referrals |
2.92% |
|
Organic Search |
16.77% |
|
Paid Search |
1.50% |
|
Social |
1.88% |
|
|
0.16% |
| Display |
0.02% |
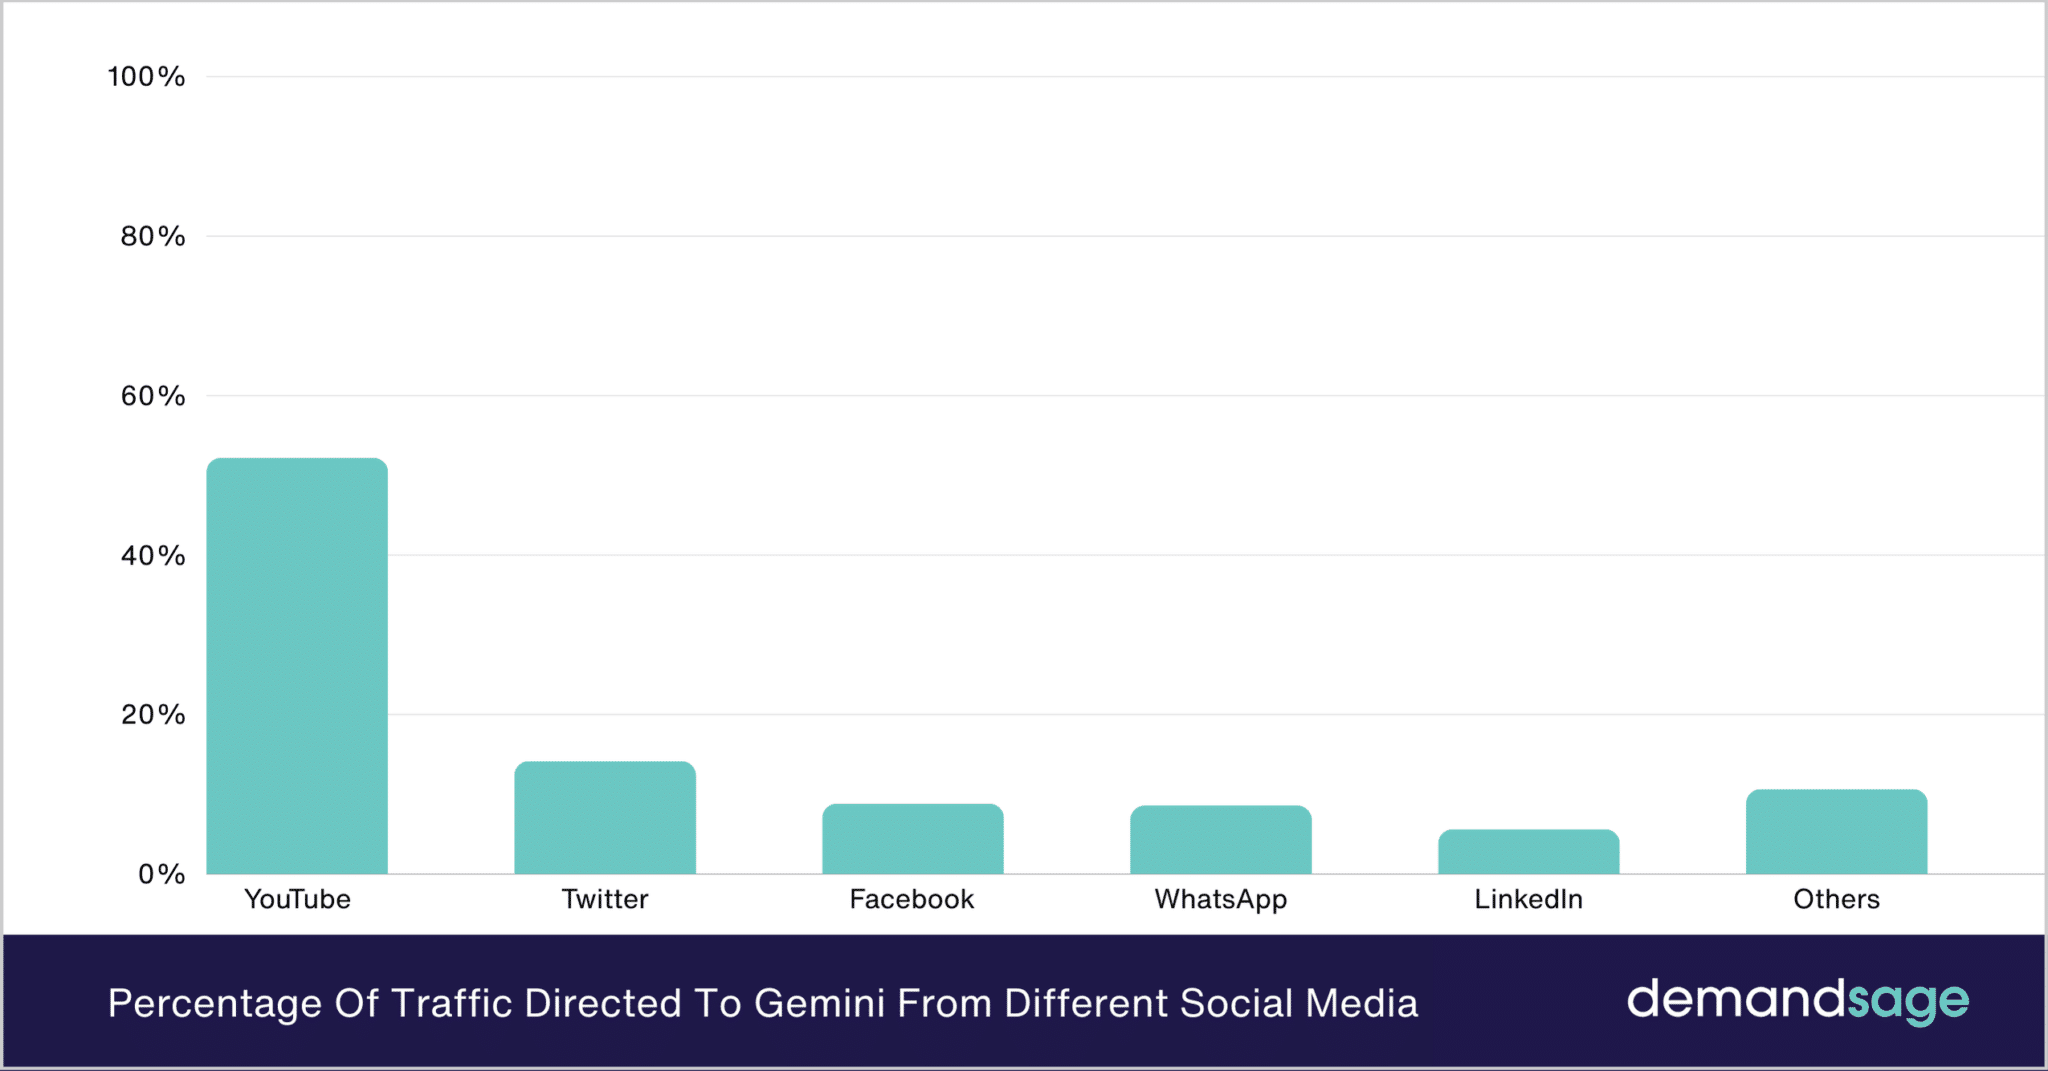
Gemini gets its social media traffic from various channels, including:
As of May 2024, there are more mobile visits than desktop visits per month.
Mobile: 170.8 million
Desktop: 143.1 million
Perplexity
Perplexity is another AI tool that is widely used as a search engine nowadays. Within two years of its launch, it had over 10 million active monthly users.
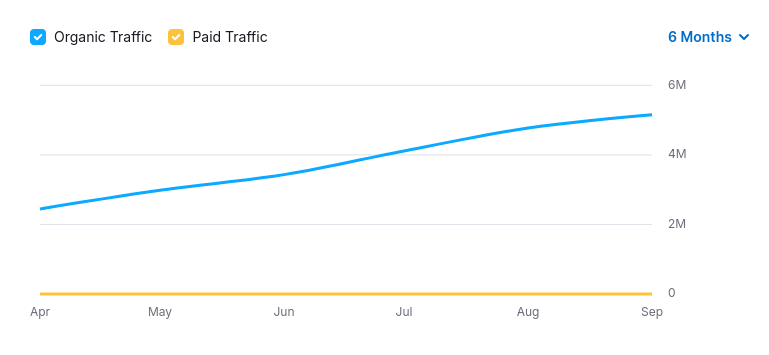
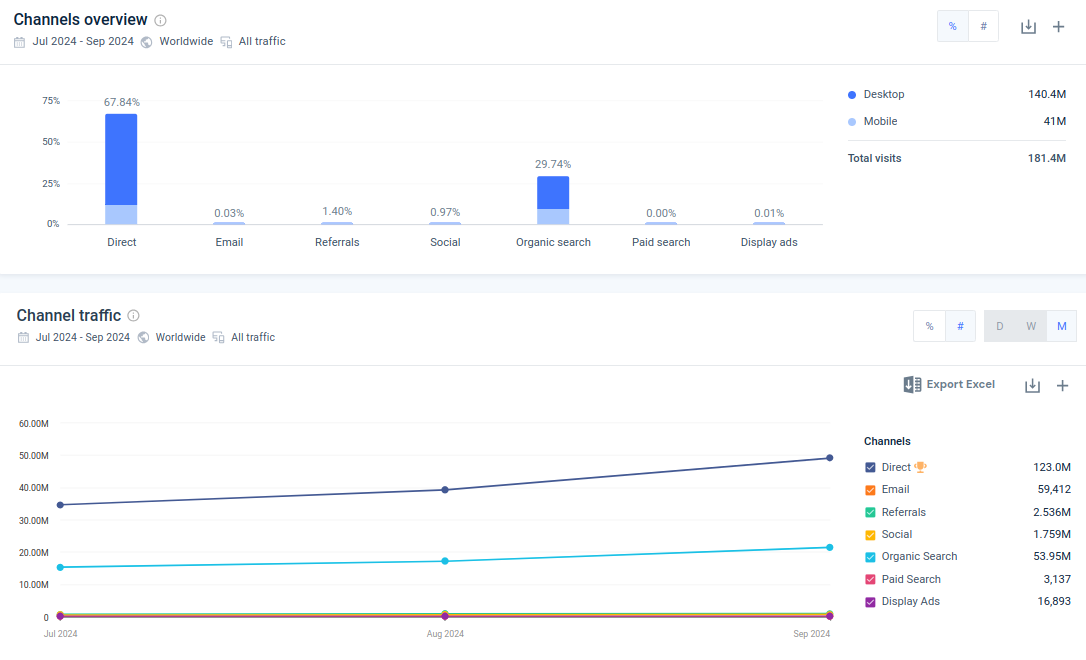
In September 2024, Perplexity had approximately 102.13 M total visits, whereas in August 2024, it had 82.1M monthly users, of which 5.15M was organic search traffic.
Perplexity AI is most popular in the US, followed by India, Indonesia, etc. Here is the breakdown of Perplexity users in different countries:
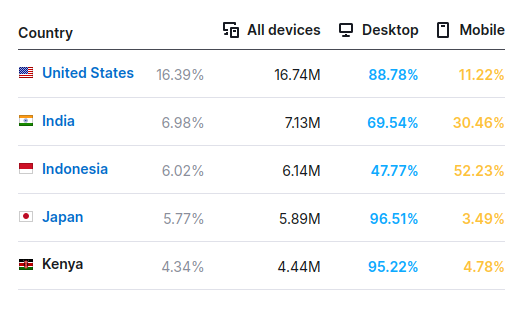
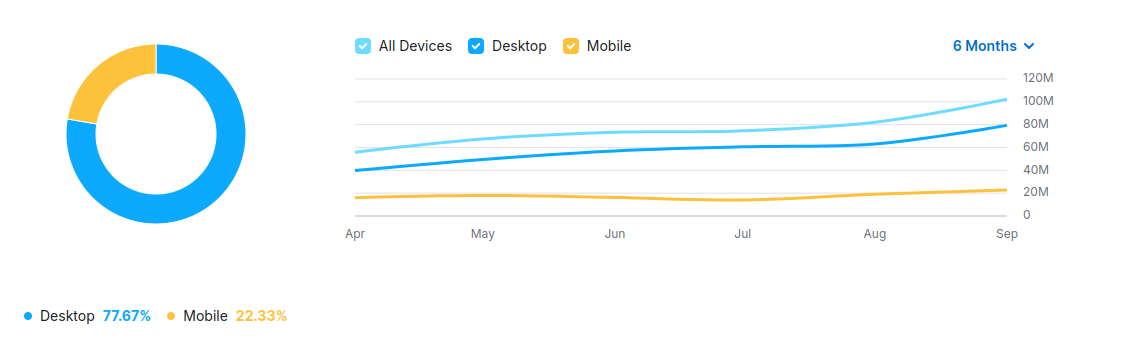
Its traffic comes from both desktop and mobile devices. The number of desktop users is 77.67%, and visitors coming from mobile devices are 22.33%.
According to Originality.ai, Perplexity’s audience based on age:
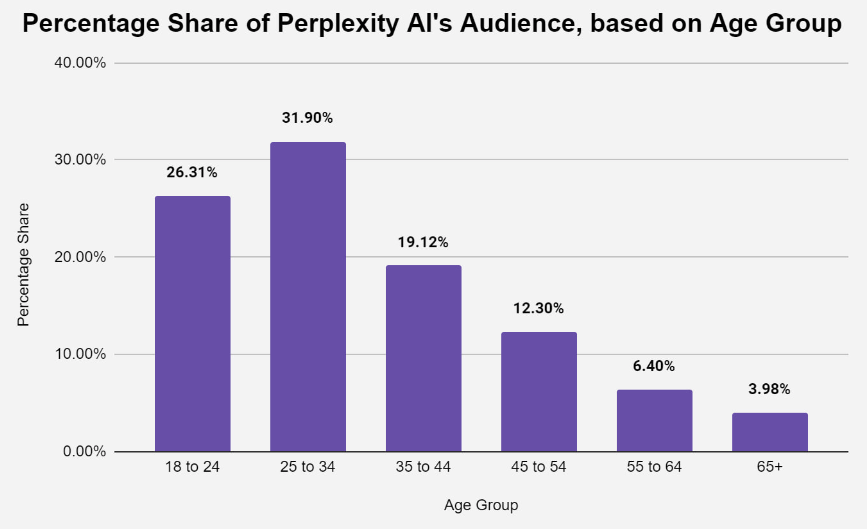
It has been recorded that Perplexity gets its traffic share directly and organic search. Here is the breakdown of its traffic share from different channels:
Jasper
Founded in February 2021 by John Phillip Morgan, Dave Rogenmoser, and Christopher Hull, Jasper AI quickly gained traction for its advanced natural language processing capabilities. Today, it boasts over 105,000 active users worldwide, holding approximately 30% of the market share in the AI writing industry.
Its user base increased by 200% from 2021 to 2023, reaching over 100,000 paying customers. Its audience is 57.22% male and 42.78% female.
Where Are Most of Jasper AI’s Users From?
Jasper AI’s user base spans the globe, but its highest concentration of users comes from Asia, accounting for 52.23% of its traffic. Here is a breakdown of the top five countries that contribute to Jasper AI’s user traffic:
United States – 31.11%
Brazil – 5.71%
India – 4.41%
United Kingdom – 3.51%
Colombia – 3.03%
Additionally, the male-to-female ratio among Jasper AI users is 60.91% male and 39.09% female.
Social Media Traffic to Jasper AI
In the digital era, social media plays a crucial role in driving traffic to various platforms, and Jasper AI is no exception. The following social media platforms contribute the most traffic to Jasper AI:
|
Social Media Platform |
Traffic Share |
|
YouTube |
33.42% |
|
|
24.9% |
|
|
13.87% |
|
WhatsApp Web |
10.36% |
|
|
4.66% |
|
Others |
12.78% |
According to similarweb, jasper.ai users by age group are as follows:
|
Age Group |
Share of Visitors |
|
18-24 |
17.94% |
|
25-34 |
31.32% |
|
35-44 |
19.64% |
|
45-54 |
13.74% |
|
55-64 |
10.25% |
|
Above 65 |
7.12% |
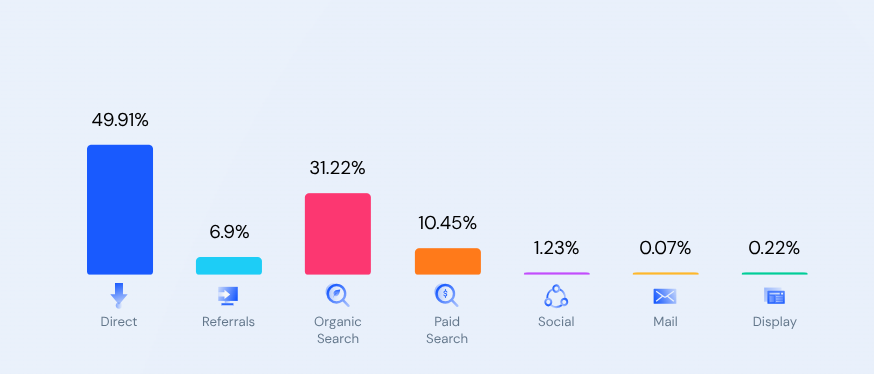
Marketing channel distribution for jasper.ai:
Jasper.ai gets 49.91% direct traffic, driving 49.91% of desktop visits last month, and Organic Search is the 2nd with 31.22% of traffic.
Referral Web Traffic to Jasper.ai:
| Category | Referral Traffic Share |
| Programming and Developer Software | 38.63% |
| Computers, Electronics, and Technology – Other | 18.3% |
| Graphics, Multimedia, and Web Design | 13.41% |
| Vehicles – Other | 5.37% |
| Finance – Other | 4.8% |
| Other | 19.49% |
Bing
Microsoft Bing was launched in 2009. It is the second-largest internet search engine after Google. Over 10.51% of people use Bing every month. It has over 3 billion monthly active users. In May 2024, the worldwide search engine market share of Bing was 3.72%, whereas Google’s share was 90.80%.
The market share of Bing is more in the US than globally. It holds 7.81% of the search engine market share in the US. Its audience is 56% male and 44% female.
Microsoft Bing is less popular among mobile users. Around 44 million desktop searchers use Bing exclusively. Bing has a market share of 38.46% among U.S. console users. This is because it is the default search engine on the Xbox.
Top countries by Bing search engine traffic share:
|
Country |
Traffic Share |
| US | 30.23% |
| China | 10.84% |
| India | 7.34% |
| Germany | 4.61% |
| UK | 4.13% |
| Others | 29.10% |
In March 2023, the top 3 queries that were searched on the Bing search engine are:
| Query | No. of searches |
| YouTube | 11452722 |
| 8060698 | |
| 12983821 |
According to demandsage, Bing users by age group are as follows:
|
Age Group |
Share of Visitors |
| 18-24 | 18.46% |
| 25-34 | 25.89% |
| 35-44 | 23.56% |
| 45-54 | 15.61% |
| 55-64 | 9.84% |
| Above 65 | 6.64% |
The Bottom Line
While Google has introduced an AI version of Google Search with the launch of AI Overviews to maintain its dominance, the future of search is shifting away from traditional browsers, evolving into AI-driven answer engines, social media searches, voice assistants, visual searches, and e-commerce site searches.
So, as user behavior changes, businesses must adapt to stay visible, ensuring they meet their audience where they search—whether through AI chatbots, video content, or interactive search experiences.